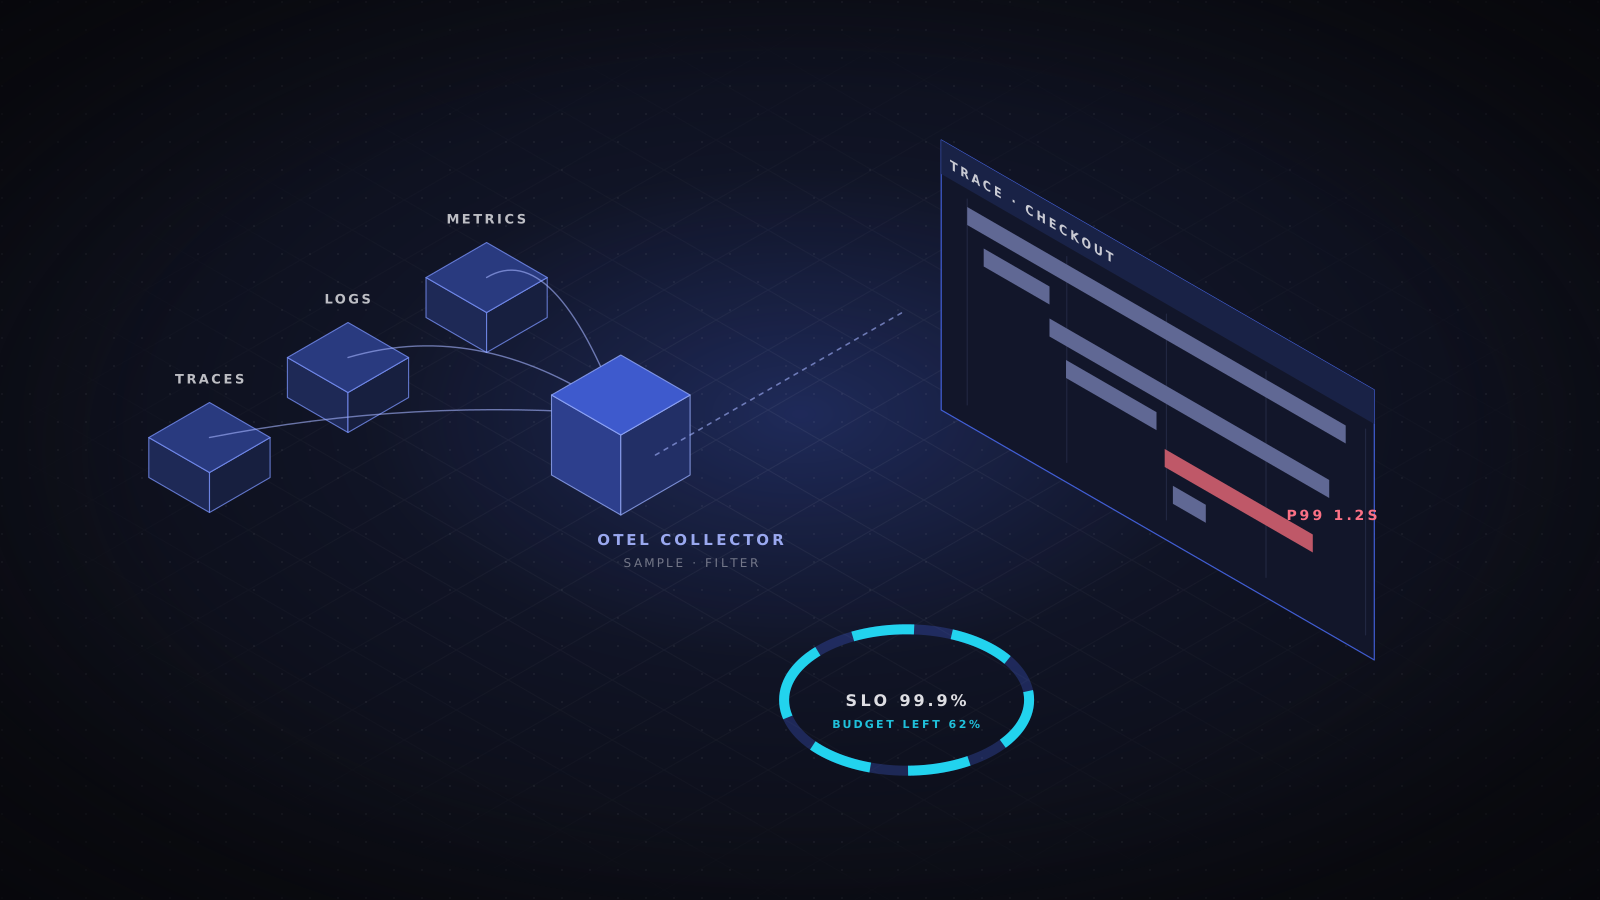
Monitoring tells you that something you anticipated has gone wrong. Observability lets you investigate failures you didn't anticipate, which in a system of dozens of services is most of them. The difference comes down to the data you collect, how it is connected, and how disciplined you are about what turns into an alert.
Standardize on OpenTelemetry
OpenTelemetry is the CNCF standard for generating and shipping traces, metrics and logs. It provides vendor-neutral APIs and SDKs, automatic instrumentation for common frameworks, and the Collector, a pipeline that receives, processes and exports telemetry. The practical benefit is leverage: you instrument your code once and keep the freedom to change backends without touching application code.
Two details make the difference between pretty traces and useful ones. First, propagate context across every hop using the W3C Trace Context headers, including through message queues, where propagation is most often forgotten. Second, follow the semantic conventions for attribute names, so http.response.status_code means the same thing in every service and every query.
Sample with intent
Keeping every trace is rarely affordable at scale, and most successful requests look the same. Head sampling decides at the start of a request and is cheap, but it throws away the rare errors you care about. Tail sampling decides after the whole trace has been seen, so you can keep every error and every slow request and sample the routine traffic.
receivers:
  otlp:
    protocols:
      grpc: {}
      http: {}
processors:
  tail_sampling:
    decision_wait: 10s
    policies:
      - name: keep-errors
        type: status_code
        status_code: { status_codes: [ERROR] }
      - name: keep-slow
        type: latency
        latency: { threshold_ms: 500 }
      - name: sample-the-rest
        type: probabilistic
        probabilistic: { sampling_percentage: 5 }
  batch: {}
exporters:
  otlp:
    endpoint: tracing-backend:4317
service:
  pipelines:
    traces:
      receivers: [otlp]
      processors: [tail_sampling, batch]
      exporters: [otlp]
Tail sampling needs every span of a trace to reach the same Collector instance. In a horizontally scaled setup, put a first tier of Collectors in front using the load-balancing exporter keyed on trace ID.
Keep telemetry costs under control
- Watch metric cardinality. A label containing user IDs, request IDs or full URLs can multiply your time series by millions. Keep those values in traces and logs, where they belong.
- Drop, filter and aggregate in the Collector before data reaches a paid backend. The cheapest byte is the one you never ship.
- Set log levels per environment and treat debug logging in production as a temporary, time-boxed exception.
- Use exemplars to link a latency spike on a metric directly to example traces, instead of retaining every trace to find one.
Let SLOs decide what matters
A service level objective states how reliable a service needs to be from the user's point of view, for example "99.9% of checkout requests succeed in under 800 ms over 28 days." The indicator is a ratio of good events to valid events. The remaining 0.1% is the error budget, roughly 40 minutes of full outage across 28 days, and it gives product and engineering a shared, numeric way to trade reliability work against feature work.
Alert on how fast the budget is burning rather than on raw thresholds. The multi-window, multi-burn-rate approach described in the Google SRE Workbook pages a human only when the budget is disappearing quickly. Over a 30-day window, a burn rate of 14.4 sustained for an hour consumes 2% of the budget, which is serious enough to wake someone. Slower burns open a ticket instead.
From alert to root cause
A good investigation path is short and repeatable. The SLO burn alert links to a dashboard of request rate, errors and duration for the affected service. An exemplar on the latency panel opens a slow trace. The trace shows which downstream call is responsible, and its trace ID pulls the exact log lines from that request. For components you cannot instrument directly, eBPF-based tooling can capture network and runtime behavior from the kernel without code changes.
When that path takes minutes instead of an afternoon, incidents get shorter and on-call gets quieter. That outcome, not the number of dashboards, is the measure of an observability program.
- Observability
- OpenTelemetry
- SLO
- SRE